Download Computer Vision exam question and more Exams Computer Vision in PDF only on Docsity!
Fundamentals of Computer Vision - Midterm Exam
Dr. B. Nasihatkon
Name: ID: Ordibehesht 1396 - May 2017
Question 1- Canny Edge detector (10 points)
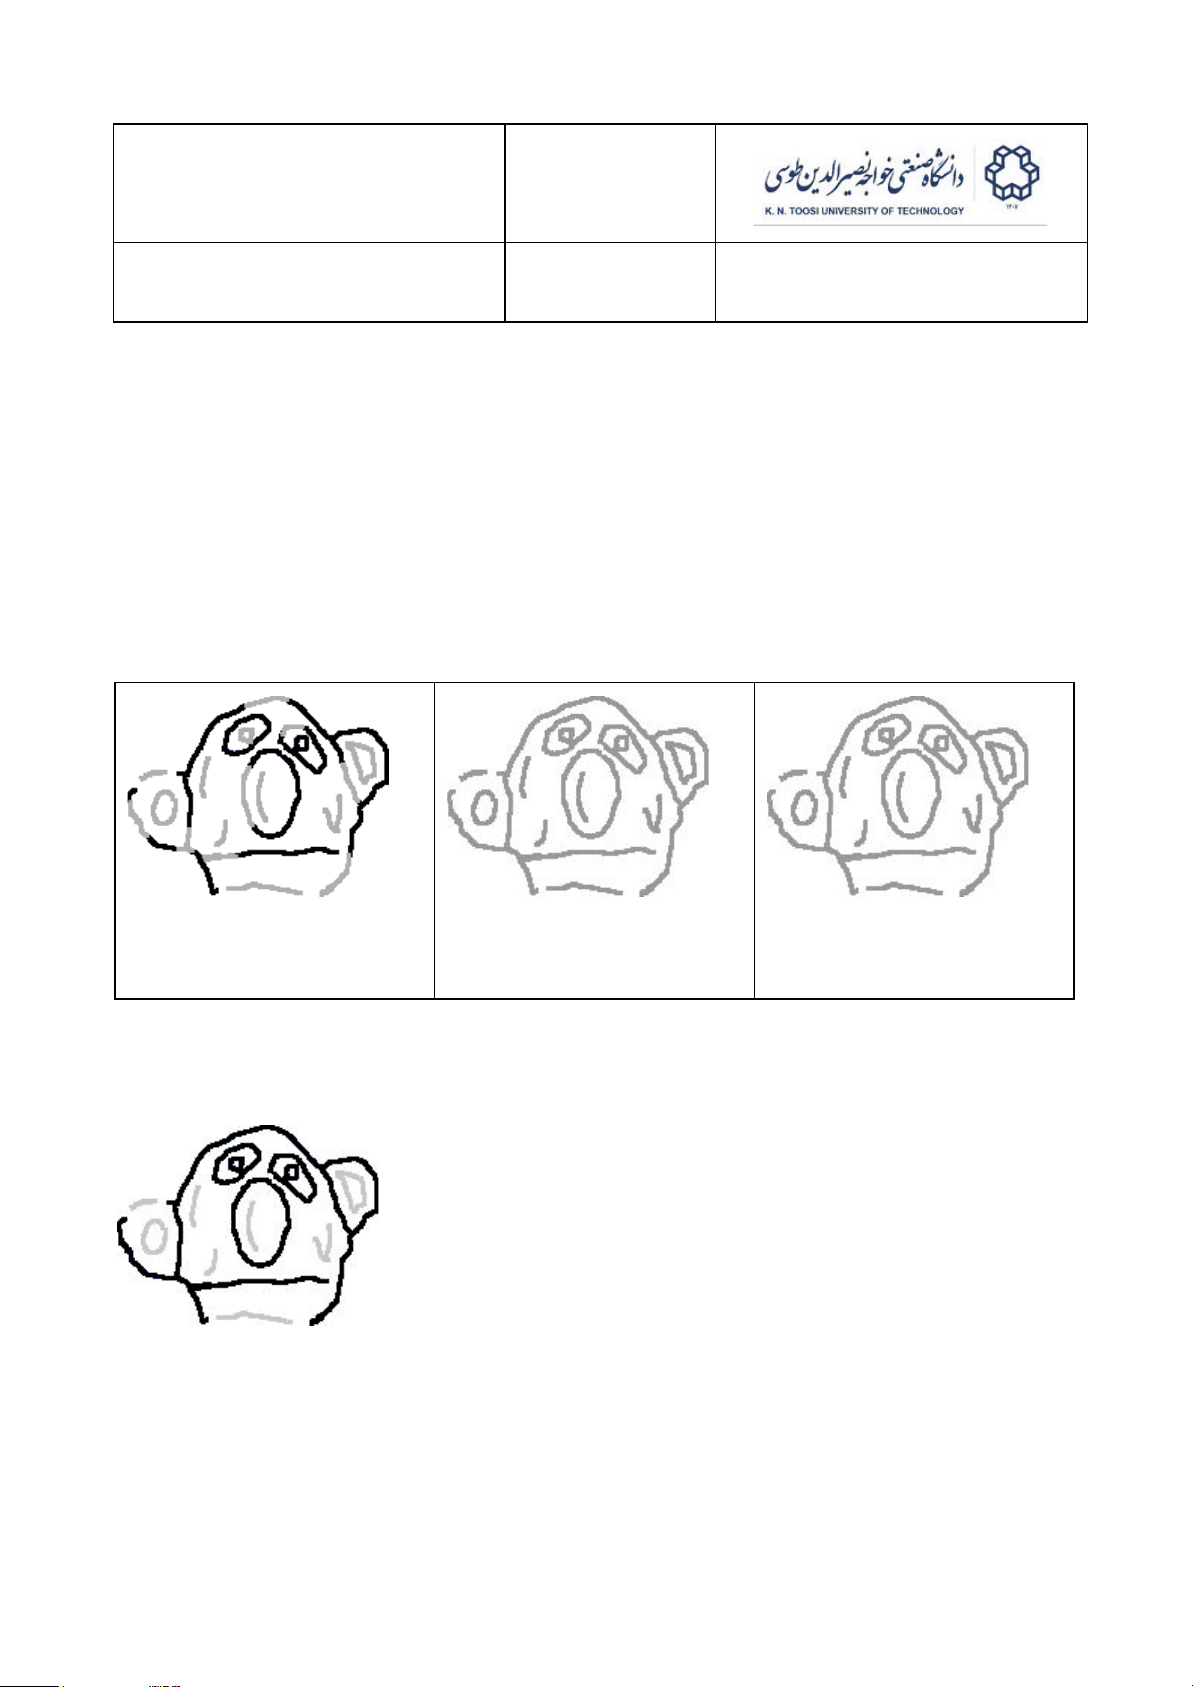
Consider the images below. The leftmost image represents the result of Canny low- and high- thresholding. The black lines represent the strong edges and the gray lines indicate the weak edges weak edges. Remember, weak edges are edges whose gradient response (magnitude) is between the low and the high thresholds, and strong edges are those whose gradient magnitude is larger than the high threshold. On the outline image on the right draw the final edges obtained by the Canny edge detector. If you screw up one of the outline images, use the other one, but, only use one of them (10 points).
(Cross out the image to the left if you are using this.)
Answer:
Question 2: Correlation, Convolution and median filtering (18 points)
Consider the filter and the image below.
Filter
Image
0 0 1 3 2
2 3 6 0 3
5 4 2 5 7
1 2 0 4 4
A) What is the output of a correlation operation on the image using the above filter? What is the result of convolution? Fill in the blank cells below (12 points.)
Correlation
X X X X X
X^7 18 19 X
X^19 8 29 X
X X X X X
Convolution
X X X X X
X^13 10 2 X
X^4 20 11 X
X X X X X
B) Apply a 3 by 3 median filter to the image above and print the results in the blank cells below (6 points.)
X X X X X
X^2 3 3 X
X^2 3 4 X
X X X X X
Question 4 - Histogram (18 points)
Look at the following histograms for images A, B, C, D, E and F, all images of the same scene. Zero and 255 represent black and white intensities respectively.
A B C
D E F
A) Which of the above histograms correspond to the following image? Explain your answer. (6 points) The histogram must have two peaks. A relatively narrow peak at darker intensities (camera man's coat and tripod's legs), and a wider peak mostly consisting of brighter intensities (the grass, the sky, the building in the background, etc.). This is because there are fewer dark pixels compared to the bright ones. Thus the answer is C.
B) Which of the images D and E has a higher contrast? Why? (4 points) D has a higher contrast since it has a wider histogram, covering a wider range of intensities.
C) How does image B look like compared to image A? Explain. (4 points) B is generally darker than A, as its histogram has been shifted to the left. But, both have about the same contrast.
D) What is the relation between images C and D? Explain your answer. (4 points) C is D with inverted intensities (negative of D ). Mathematically C = 255 - D.
Question 5 - Hough Space (18 points)
Assume that the lines are parameterized with an angle θof the line normal and a distance ρ from the origin:
A) For each of the lines in the image space below (left), draw the corresponding point in the hough space (right). Use letters A, B, C and D to mark the points. You need to also write the point coordinates ( arctan (2) ≃ 64 degrees). Assume ρ ≥ 0 and 0 ≤ θ < 180.(12 points)
Image Space Hough Space
B) For each of the points in the hough space below (left), draw the equivalent line in the image space (right). On each line draw at least two points (for example, intersection with the x and y axes, if possible. Or two other points). You just need to draw a line segment in the first quadrant of the coordinate system ( x ≥ 0, y ≥ 0). (6 points)
Hough Space Image Space