Stat 104 – Lecture 19
1
1
Population
• Shape: Looks like a normal model.
•Center:
–Mean,
•Spread:
–Standard Deviation,
16=
µ
5=
σ
2
Distribution of the
Sample Mean,
•n = 5
• Shape: Normal model
•Center: Mean,
• Spread: Standard Deviation,
y
16=
µ
()
24.2
5
5
SD === n
y
σ
3
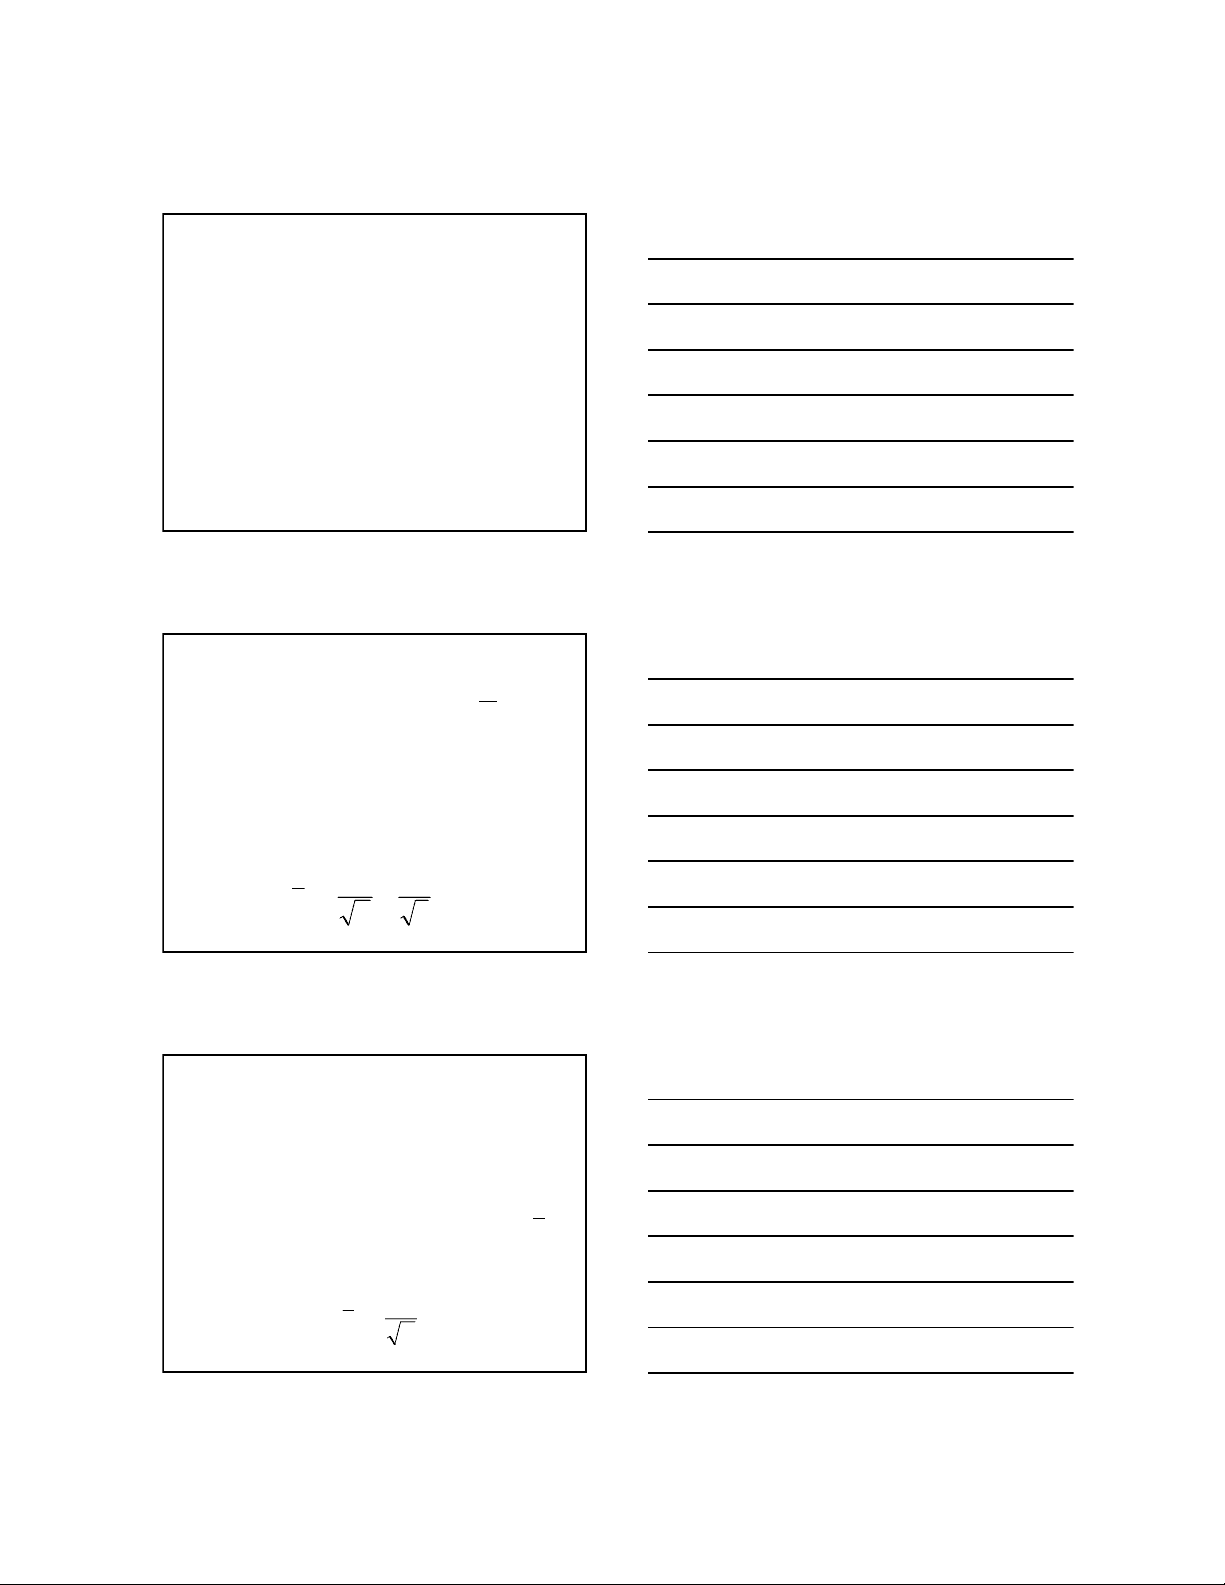
Summary
• Sampling from a population that
follows a Normal Model.
• Distribution of the sample mean,
–Shape: Normal model
–Center:
–Spread:
y
µ
()
n
y
σ
=SD