Download Sampling Theory and Aliasing: Understanding Digital Signals and Spectrum and more Slides Signals and Systems Theory in PDF only on Docsity!
LECTURE OBJECTIVES^ ^
SAMPLING can cause ALIASING^ ^
Sampling Theorem Sampling Rate > 2(Highest Frequency)
^
Spectrum for digital signals, x[n]^ ^
Normalized Frequency
A π
π
ω
ω
2
2
ˆ^
=
=
s
s^
f f
T
ALIASING
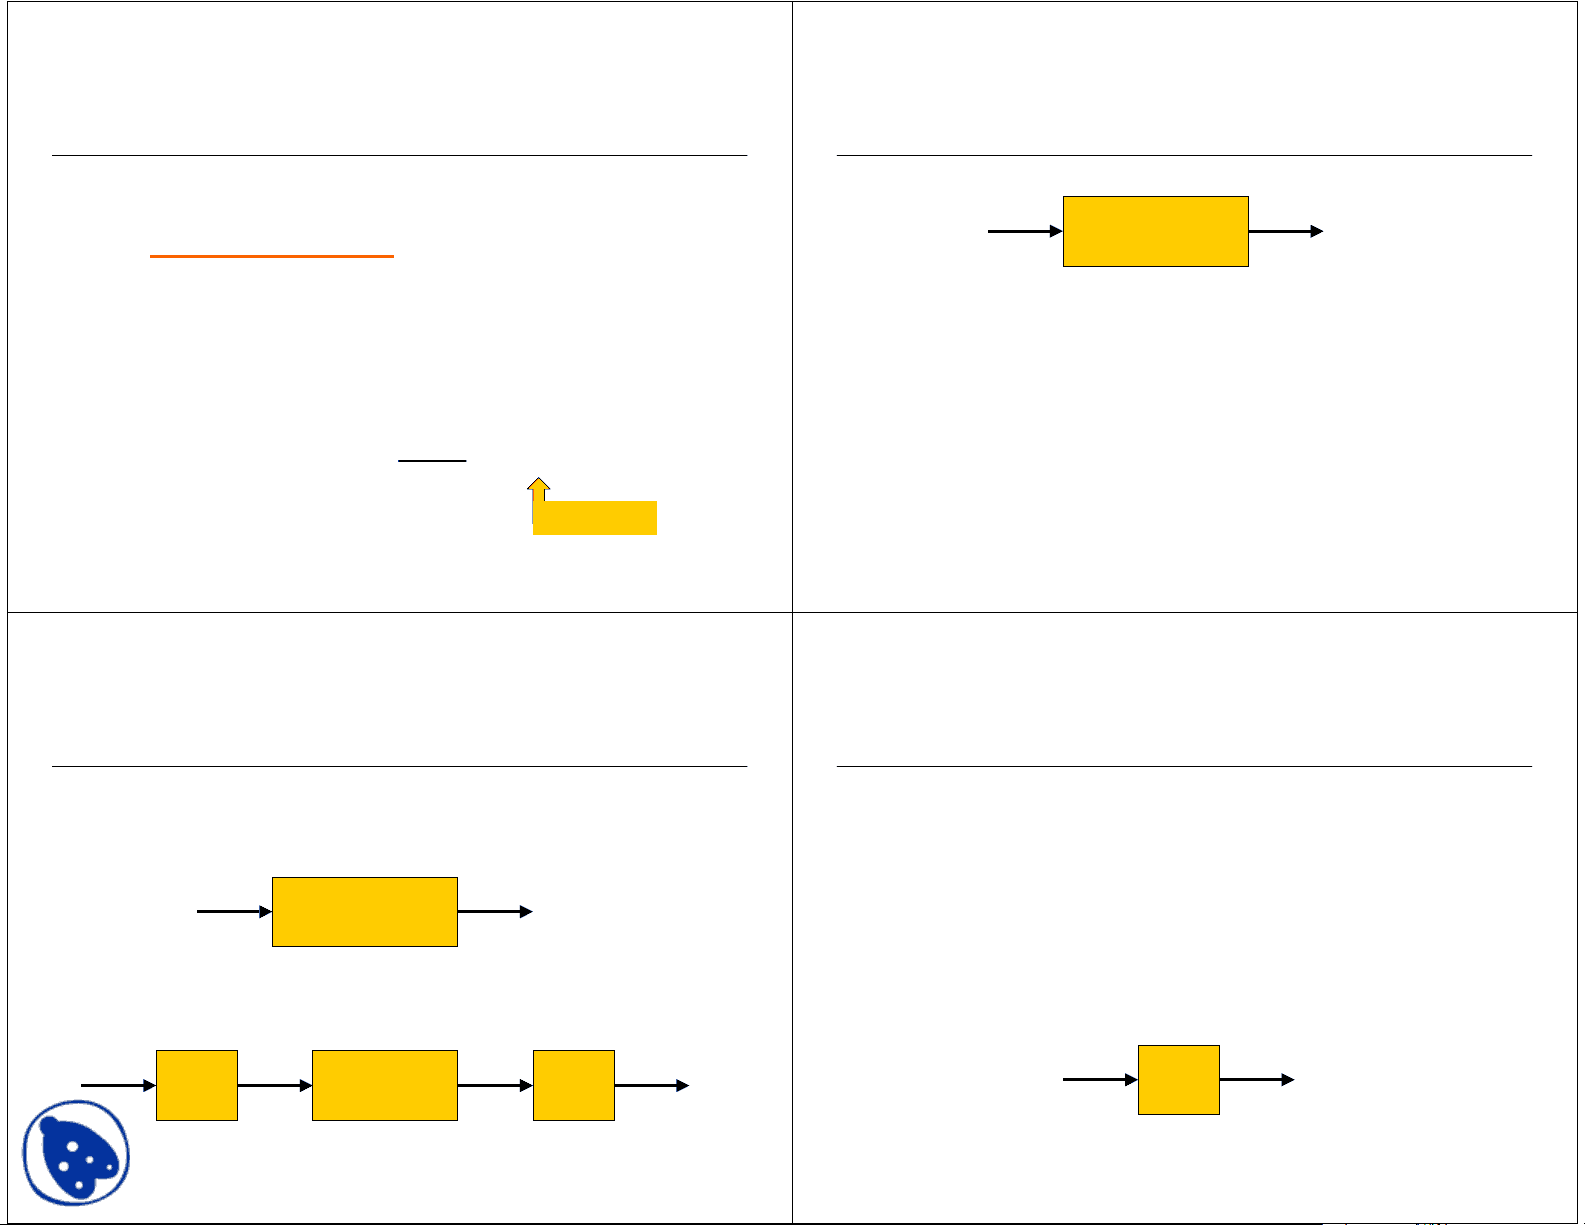
SYSTEMS Process Signals^ ^
PROCESSING GOALS:^ ^
Change x(t) into y(t)^ ^
For example, more BASS ^ Improve x(t), e.g., image deblurring ^ Extract Information from x(t)
SYSTEM
x(t)
y(t)
System IMPLEMENTATION ^
DIGITAL/MICROPROCESSOR
^ Convert x(t) to numbers stored in memory
ELECTRONICS
x(t)
y(t)
COMPUTER
D-to-A
A-to-D
x(t)
y(t)
y[n]
x[n]
^
ANALOG/ELECTRONIC:
^ Circuits: resistors, capacitors, op-amps
SAMPLING x(t)^ ^
SAMPLING PROCESS
^ Convert x(t) to numbers x[n] ^ “n” is an integer; x[n] is a sequence of values ^ Think of “n” as the storage address in memory
^
UNIFORM SAMPLING at t = nT
s
^ IDEAL: x[n] = x(nT
)s (^) C-to-D
x(t)
x[n]
docsity.com
SAMPLING RATE, f
s
^
SAMPLING RATE (f
)s
^ f
=1/Ts^
s ^ NUMBER of SAMPLES PER SECOND ^ T
= 125 microsecs
Æ
f^ s
= 8000 samples/sec
^
UNIFORM SAMPLING at
t = nT
= n/fs
s
^ IDEAL: x[n] = x(nT
)=x(n/fs
)s
C-to-D
x(t)
x[n]=x(nT
)s^
fs^
=^ 2 kHz f =^ 500Hz s
Hz (^100) = f
SAMPLING THEOREM^ ^
HOW OFTEN?^ ^
DEPENDS on FREQUENCY of SINUSOID ANSWERED by SHANNON/NYQUIST Theorem ALSO DEPENDS on “
RECONSTRUCTION
Reconstruction?
Which One?
)
(^4). 0
cos( ] [^
n
n x
π
=^
cos( ) (^4). 0 cos(
integer an is
When
n
n n
Given the samples, draw a sinusoid through the values
docsity.com
9/14/
EE-
Fall-
jMc
17
SPECTRUM (DIGITAL) ??? ˆ ω =
2 π
f f s
f^ s^
=^ 100 Hz
ˆ ω
1 X 2
1 X 2
2 π(1)π(1)π(1)π(1)
-
ππππ
x [ n
]^ is zero frequency???
cos( ] [
ϕ
π^
=^
n
A
nx
The REST of the STORY^ ^
Spectrum of x[n] has more than one line foreach complex exponential^ ^
Called
ALIASING
^ MANY SPECTRAL LINES
^
SPECTRUM is PERIODIC with period =
^2
^ Because A^ cos( ˆ
ω
n
ϕ
)^
=^
A
cos(( ˆ
ω +
2
π^
) n
ϕ
)
ALIASING DERIVATION^ ^
Other Frequencies give the same
ˆ ω Hz
1000
at
sampled ) 400 cos( )( 1
=^
fs
t
t x
π
cos( )
cos( ] [^
1000
1
n
n x^
n
π
Hz 1000
at
sampled )
2400 cos( )( 2
=^
fs
t
t x
π
cos( )
cos( ] [^
1000
2
n
n x^
n
π
cos( ) 2
(^4). 0 cos( ) (^4). 2 cos( ] [ 2
n n n n n x π
π
π
π^
]
[
]
[^
1
2
n x n x^
) (^1000) ( 2
400
2400
π π
π^
=
−
ALIASING DERIVATION–2^ ^
Other Frequencies give the same
s
s^
f
f
T
π
ω
ˆ^
=^
A π
ˆ ω
s
s
s
s
s
f
f
f f
f
f f^
A
A
2 2 ) ( 2 ˆ :
then
=
=
and we want :
x [
n ]
=
A
cos( ˆ
ω
n^
+ϕ
)
If^
x^ (
t )^
=^
A^
cos( 2
π(
f^
+^
A f
) s t^ +
ϕ^
)^
t^ ←
n fs
docsity.com
ALIASING CONCLUSIONS^ ^
ADDING f
or 2fs
or –fs
to the FREQ of x(t)s
gives exactly the same x[n]^ ^
The samples, x[n] = x(n/ f
) are EXACTLYs^
THE SAME VALUES
^
GIVEN x[n], WE CAN’T DISTINGUISH f
o
FROM (f
+ fo
) or (fs
+ 2fo
)s
NORMALIZED FREQUENCY^ ^
DIGITAL FREQUENCY
s
s^
f f
T
π
ω
ω
2
ˆ^
=
=
A π 2
SPECTRUM for x[n]^ ^
PLOT versus NORMALIZED FREQUENCY
^
INCLUDE
ALL
SPECTRUM LINES
^ ALIASES
^ ADD MULTIPLES of 2
ππππ
^ SUBTRACT MULTIPLES of 2
ππππ
^ FOLDED ALIASES
^ (to be discussed later) ^ ALIASES of NEGATIVE FREQS
9/14/
EE-
Fall-
jMc
24
SPECTRUM (MORE LINES)
ˆ ω
1 X 2
1 X 2
2 π(0.1)π(0.1)π(0.1)π(0.1)
–0.
ππππ
1 X 2
1.
ππππ
1 X 2 –1.
ππππ
) ) (^1000) / )( (^100) ( 2 cos( ][
ϕ
π^
=^
n
A nx
kHz 1 = s f
f fs
π ω
ˆ^ =
docsity.com