Physics 31210 Lab 3
Static and Kinetic Friction
Introduction:
Friction can thought of as a force that opposes motion. It never pushes! When friction is strong enough
to prevent an object from moving, we call it static friction. In this lab, you will measure the coefficients of
friction between the block and a wooden board. To study how an incline effects motion, you will draw force
diagrams that relate gravity, friction, and the normal force.
Static friction has a maximum value – it can only hold back so much force. Frictional force is related to
the normal force on an object by
s
(the coefficient of static friction):
Ff≤sN
. If an object is moving
with frictional effects, we call this kinetic friction and use
k
(the coefficient of kinetic friction). The
relationship between kinetic friction and normal force is
Ff=kN
.
Study I: Using the worksheet (page 5) draw and label the force diagram for the block. Determine the
relationship between
s
and θ. Don't forget to find
s
. Have a TA check your work.
Study II: Measuring Static Friction (
s
).
Imagine pushing on a very heavy box. You can push quite hard without any movement at all. Then suddenly
you reach the “break away” point and the box starts sliding.
1. Set up your inclined plane using the materials provided. Adjust your ramp so it is at a fairly small angle (the
block shouldn't slide when set down).
2. Choose one side of your block for all measurements . Place the block on it and carefully lift until it begins to
slide. Once you've got a rough idea of the angle, use a lab jack to do a fine adjustment and get the “just
slipping” point. Use the blue tape to reduce random uncertainty.
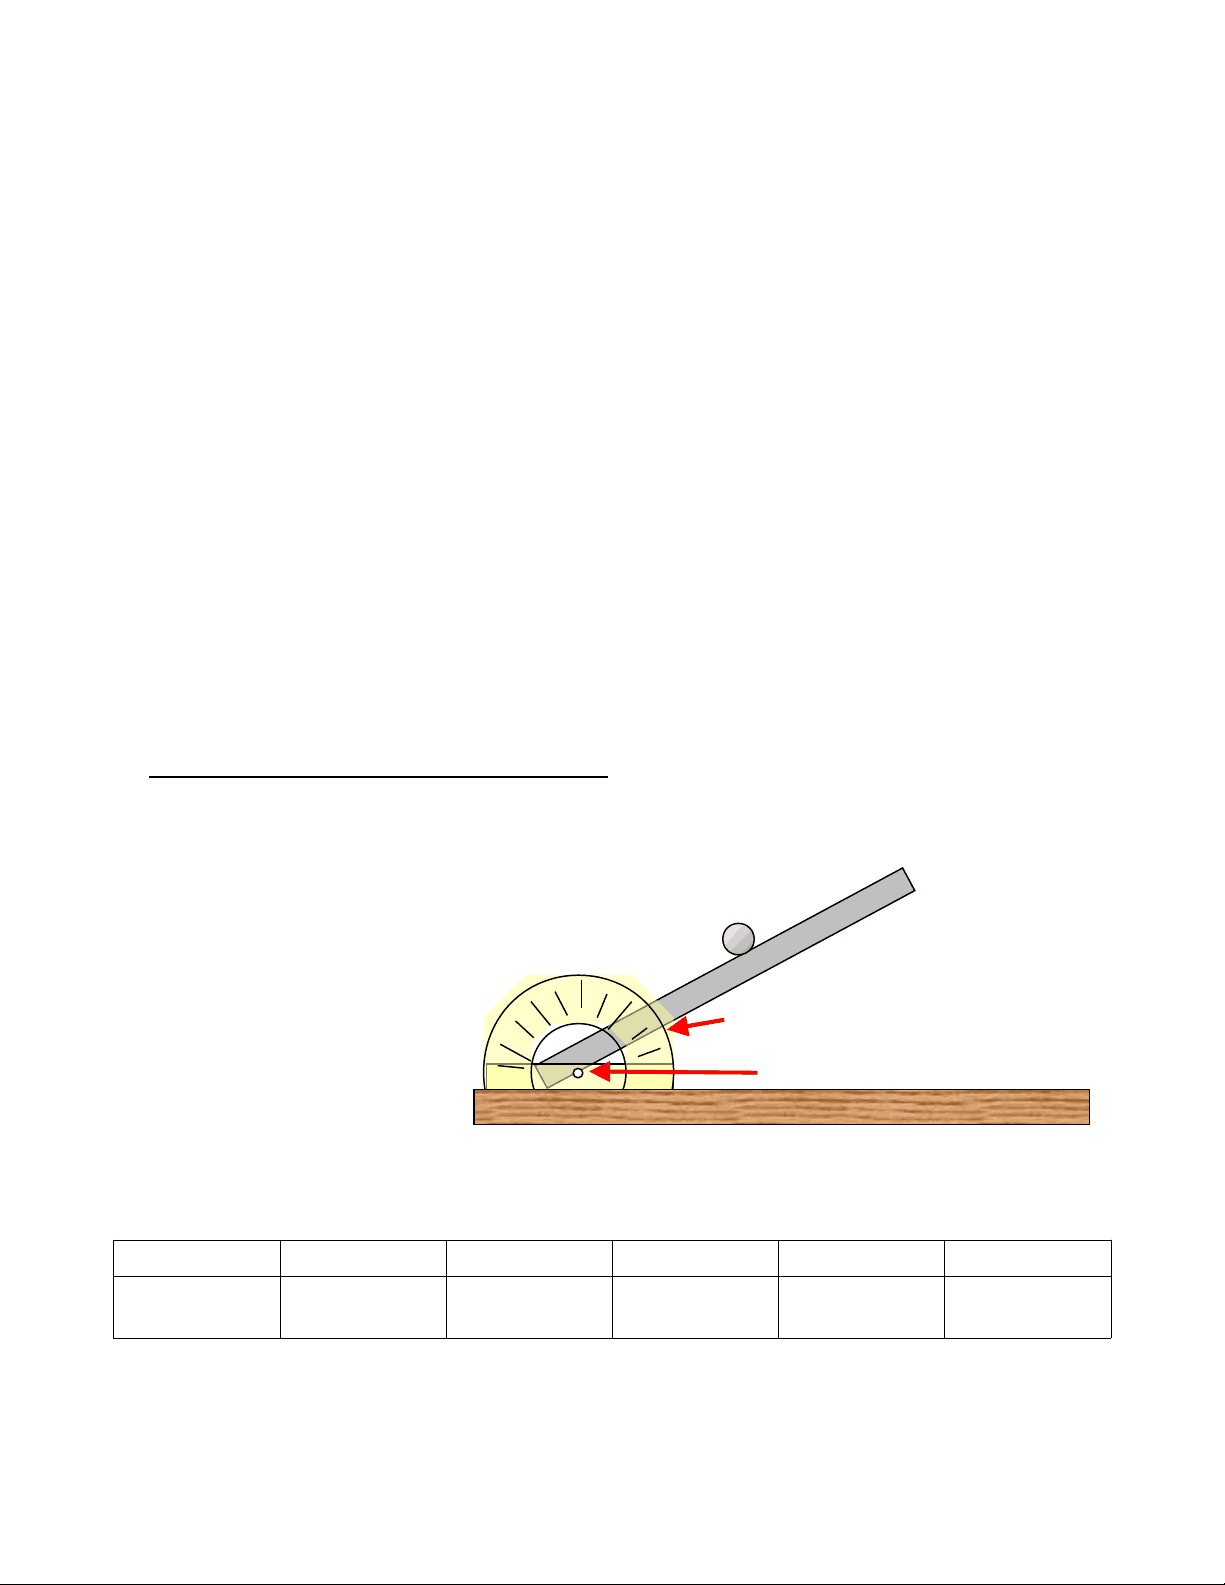
3. Measure the sliding angle with the
large wooden protractor. There are
a few different types of protractors
in lab and it is easy to misuse them
and introduce a systematic
uncertainty in your data. Get a
lesson in protractor reading if
necessary.
4. Repeat this measurement 5 times
(remember to always use the same side of the block). If there any obvious outliers in your data set, feel free
to retake a measurement. This is a measurement with a lot of natural variation, so repeating this
measurement 50 times would be appropriate (but not necessary).
Trial 1 2 3 4 5
θ
1
Read protractor here, on bottom edge of ramp
Line u p the center of the protractor with
the base corner of the ramp.