Download Oceanography - Planet Earth - Lecture Slides and more Slides Earth, Atmospheric, and Planetary Sciences in PDF only on Docsity!
OCEANOGRAPHY:
Physical (Currents, waves, ocean
basins)
Biological (Marine Biology)Biological (Marine Biology)
Chemical (Ocean waters, marine
pollution)
Marine Geology (Ocean basins, marine
geology processes)
Significance of the Oceans
1. Abundant Life
2. Sediments/Ores (iron, salt, gypsum, limestone)
3 C3. Coastline (sea level changes, coastal processes) tli ( l l h t l )
4. Ocean – Atmosphere Interaction (weather)
5. Ocean – Climate effects (CO 2 storage)
Waters of the Oceans:
1. Oceans are 3 billion years old (de-
gassing of Earth)
2. Salty because of dissolved elements from
continents (todaycontinents (today, in equilibrium)in equilibrium)
3. Composition of seawater:
H 2 O + 3.5% salts (Na, Cl, SO 4 , Ca, K, Mg)
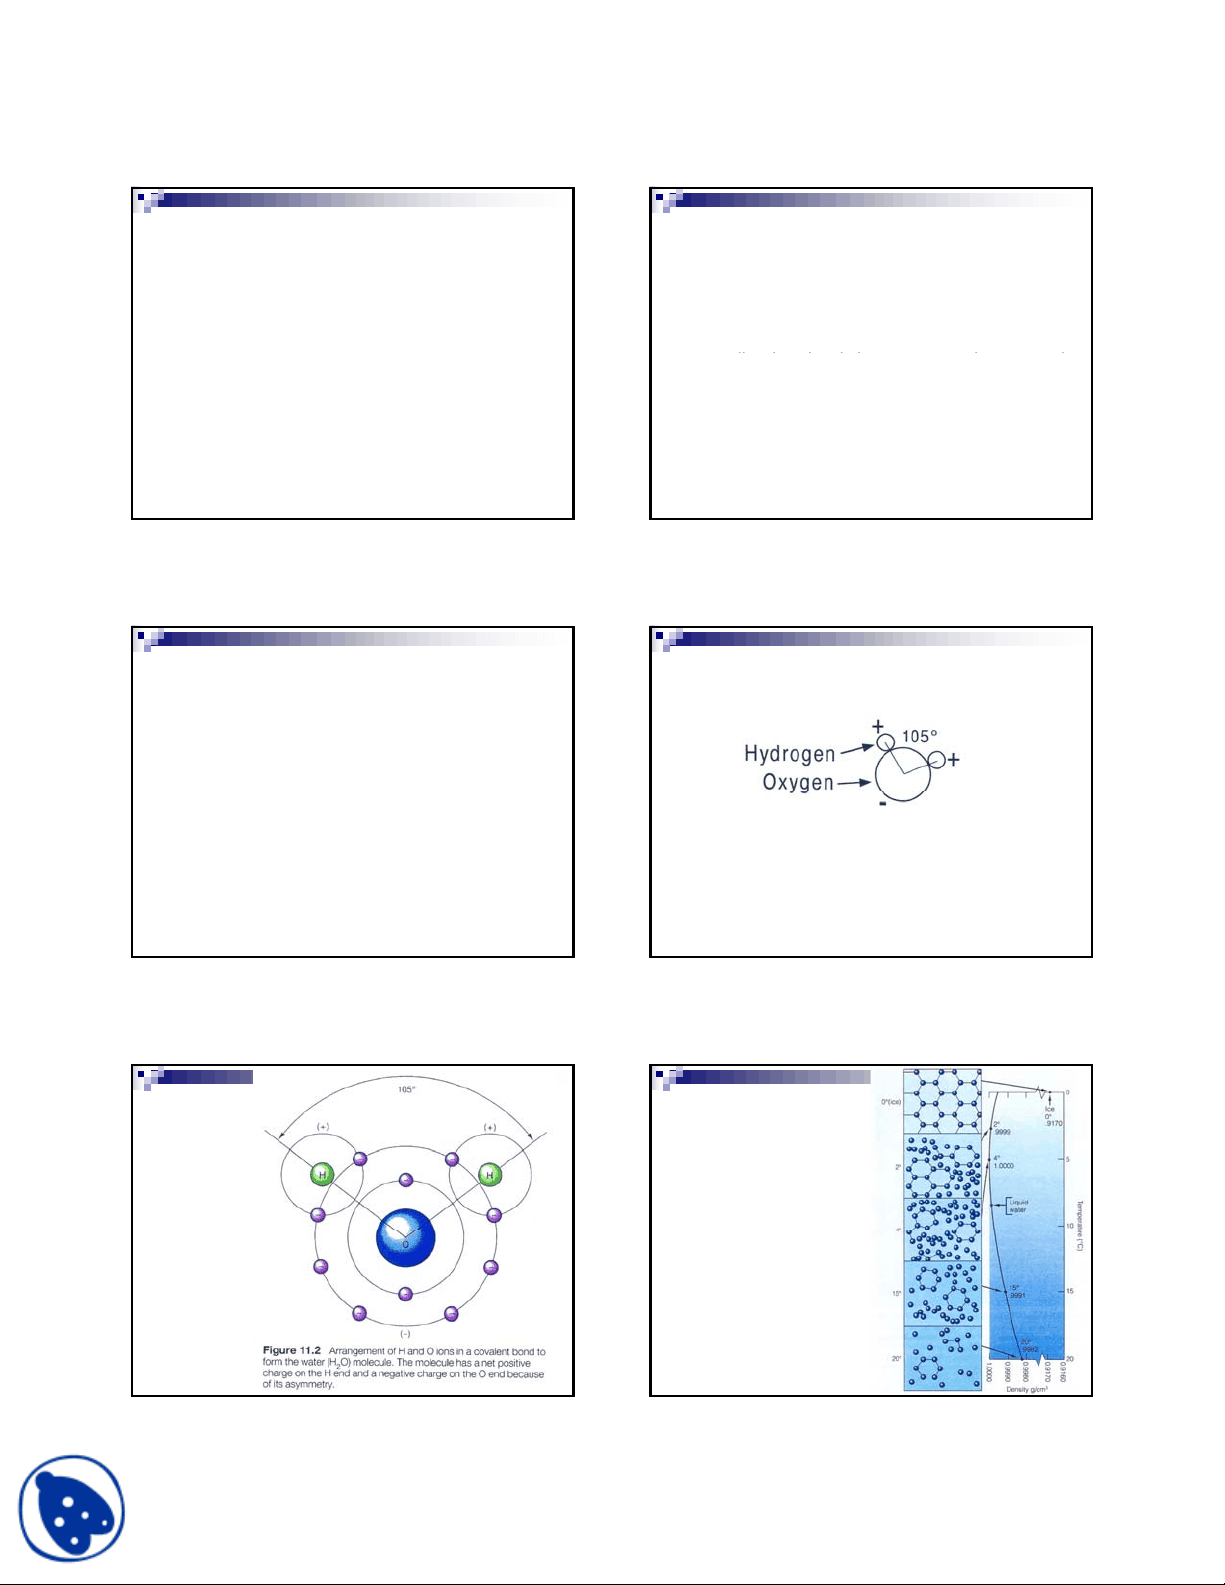
4. Properties of water, H 2 O
-- Dipolar molecule
-- Good solvent -- Expands on freezing -- High surface tension -- Exists in solid, liquid and gas form on Earth
The reason
for the 105
degree angle
in the water
molecule
0 o (ice)
2 o
4 o
As water freezes, the dipolar water molecules begin to arrange themselves into hexagonal patterns because of the electrical bonds formed by the positive and negative sides f th l l
Density = 1.
Density = 0.
15 o
20 o^ C
of the molecules.
This explains the hexagonal symmetry of snowflakes and ice crystals and the unusual property that ice is less dense than water. Density = 0.
Photos of single ice
crystals showing
hexagonal symmetry
Ocean Waters – Relative proportions of water and dissolved salts in seawater
Figure 9.3, text Salinity: o^ /oo = Parts per Thousand; 35 o^ /oo = 3.5%
Polar views
contrasting
areas
covered by
oceans
Figure 9.1, text
Distribution of Land and Water, Graph and Map
Figure 9.2, text
Differences in surface salinities partially caused by variations in precipitation (also see Figure 9.4, text)
Fluctuating location of shoreline due to glacier formation or melting (also see Figure 4.19, text)
Other features of ocean bottom bathymetry
Bathymetric profile (ocean depth) across the Atlantic Ocean, Figure 9.15, text.
Black
smokers
at mid-
ocean
ridges
Black
smokers
at mid-
ocean
ridgesid
http://www.ngdc.noaa.gov/mgg/global/global.html http://www.ngdc.noaa.gov/mgg/image/2minrelief.html http://www.ngdc.noaa.gov/mgg/fliers/97mgg03.html
URLs for some ocean bathymetry images:
http://www.ngdc.noaa.gov/mgg/image/global topo large.gifp g g gg g g _ p _ g g
Figure 9.13, text
http://www.ngdc.noaa.gov/mgg/image/global_topo_large.gif http://www.ngdc.noaa.gov/mgg/image/relief_slides2.html
http://www.ngdc.noaa.gov/mgg/image/2minrelief.html
More on Water
Earth’s Water Balance – the Water Cycle (Figure 3.6, text); primary movements of water shown by large arrows
Evaporation Precipitation
Note ~ circular
path or cycle
Infiltration
(groundwater
recharge)
Runoff
path or cycle
How much water do we use each day? (individual use – not industrial) Daily use, family of 4 Use Amount (liters/day) Drinking, cooking 30 (1976 data) Dishwasher 57 Toilet 363 BathingBathing 303303 Laundry 130 Watering Plants 4 Sink, disposal 13 Total 900
or, 240 liters/day!
(More recent data suggest that the amount is 350 liters/day)
http://www.ngdc.noaa.gov/mgg/global/global.html http://www.ngdc.noaa.gov/mgg/image/2minrelief.html http://www.ngdc.noaa.gov/mgg/fliers/97mgg03.html
URLs for some ocean bathymetry images:
http://www.ngdc.noaa.gov/mgg/image/global topo large.gifp g g gg g g _ p _ g g
Figure 9.13, text
http://www.ngdc.noaa.gov/mgg/image/global_topo_large.gif http://www.ngdc.noaa.gov/mgg/image/relief_slides2.html
http://www.ngdc.noaa.gov/mgg/image/2minrelief.html
Causes of Ocean Currents:
1. Tides (Earth, Moon, Sun gravitational attraction)
cause surface waters to move
2. Trade winds (surface friction at ocean/
atmosphere interface)
3. Temperature variations
-- Warm waters rise, cool waters sink
due to density variations
-- Heating and cooling of waters related
primarily to location (polar, mid-latitude,
equatorial), climate, seasons and weather
4. Salinity variations (Excess evaporation in some
locations leads to increased salinity, and
therefore density, and sinking waters
Results: Once water is moving, direction of the
current is influenced by the Coriolis Effect
(deflection to the right in N hemisphere) the
Causes of Ocean Currents (continued):
(deflection to the right in N. hemisphere), the
shape of the ocean basin and changes in one or
more of the four causes of currents.
Currents cause mixing, dispersal, and, sometimes,
concentration.
South Pole Equator North Pole
s s s
h (meters)
s
s
s
Atlantic Ocean
Ocean bottom
South to North bathymetric profile of the Atlantic Ocean and temperature contours (degrees C). Note that resulting currents (arrows) cause “pole-ward” surface current.
Depth
s
s
s
Color contour map of forecast daily high temperature
Color contour map of forecast daily high temperatures and contour lines.
Primary surface ocean currents in Atlantic and Pacific Oceans. Deflection to the right in the Northern hemisphere cause clockwise circulation.
Major Ocean Currents – red arrows show warm currents, blue arrows show cold currents (text, Figure 10.3)
Bay of Fundy tides, up to ~16 meters (http://www.planetware.com/map/bay-of-fundy-tide-levels-map-cdn-cdn15.htm)
Extreme tides in the Bay of Fundy, Nova Scotia
Extreme tides in the Bay of Fundy, Nova Scotia (text, Figure 10.26)
Location of the Mediterranean Sea (note ~ 35 degrees N latitude) and the Strait of Gibraltar (arrow).
West to East cross section showing currents in the Mediterranean Sea caused by excess evaporation and “closed” ocean basin. Shallow waters become more saline through evaporation and then sink. Surface flow from the Atlantic (from the west) provides relatively low salinity surface waters. Result is a density-driven current.
Ocean current discovery during World War II resulted in strategic military advantage.
Today: Oceanography – Ocean Pollution
Today – Ocean Pollution – an example of human
impact on the Earth (we will focus on oil pollution as it
is a significant source of ocean pollution and relates to
our energy supply and demand that is a challenge for
the next several decades)the next several decades)
Ocean Pollution:
- Natural:
Oil seeps
Black smokersBlack smokers
Algae (some is toxic to fish
and shellfish, “red tide”)
- Human caused:
Oil spills
Chemicals (runoff -- oil, fertilizers,
pesticides, industrial waste)p , )
Sewage
Solids (metals, plastics)
Acid Rain and other airborne pollution
BTU Content of Common Energy Units
1 barrel (42 gallons) of crude oil = 5,800,000 Btu 1 gallon of gasoline = 124,000 Btu 1 gallon of heating oil or diesel fuel = 139,000 Btu 1 cubic foot of natural gas = 1,026 Btu 1 gallon of propane = 91 000 Btu
Energy Units and Conversions:
Exploring Planet Earth
1 gallon of propane 91,000 Btu 1 short ton of coal = 20,681,000 Btu 1 kilowatthour of electricity = 3,412 Btu U.S. Units Equivalent Metric Units 1 British thermal unit (Btu) = 1,055.05585262 joules (J) 1 calorie (cal) = 4.1868 joules (J) 1 kilowatthour (kWh) = 3.6 megajoules(MJ)
U.S. Annual Energy Flow (2006, EIA Annual Energy
Review, Quadrillion Btu)
Energy Flow:
Exploring Planet Earth
Annual US
Production
Annual
World Production
World Oil Consumption (est. after 2005)
Natural Resources - Energy
US uses ~21 million barrels of petroleum/day!
Renewable and Alternative Energy (US):
Exploring Planet Earth
Some facts about oil – past,
present and future outlook
The world has used about 1 trillion barrels
(1 barrel = 42 gallons ~ 159 liters)
There are ~ 2 +/There are ~ 2 +/- 1 trillion barrels remaining 1 trillion barrels remaining
Current consumption: World ~ 90 million barrels/day = 33 billion barrels/yr; US ~ 21 million barrels/day = 8 billion barrels/yr
Oil and natural gas are found in underground reservoirs (in “traps”) in the pore spaces (the spaces between small grains, such as in sandstone) in porous rock.
Transporting
Oil by Tanker
Video on Exxon Valdez Oil Spill:
1. 1989, Prince William Sound, Alaska
2. Nova program (excerpts) about 1 year later
3. Significance:
Oil is one of the major ocean pollutants
Exxon Valdez spill brought US and
worldwide attention to this problem
Sources of Oil Pollution:
1. 33% Normal Tanker operation
2. 36% Industrial & Urban runoff
3. 5 – 10% Spills from Tankers
Other Factors:
Economics/Cost
Other Pollution Sources:
Some
Energy
Alternatives
for the
Future
(Aug.,
Shoreline Processes:
1. Erosion and deposition along beach are natural
and inevitable processes.
2. Long term effects:
-- Sea level rise and fall
-- Uplifting or subsiding (sinking) coastlinesUplifting or s bsiding (sinking) coastlines
3. Effects of human-made structures:
-- Coastal development
-- Dune & beach nourishment
-- Breakwaters, groins
- Surf and tidal zone susceptible to storm
damage (most erosion during storms)
5 ~75% of US population lives in counties
Shoreline Processes (continued):
- 75% of US population lives in counties
adjacent to shorelines
TS Noel, Nov. 1, 2007
Beach erosion in Florida, TS Noel, Nov. 1, 2007
Wave moving onto shore (text, Figure 10.12)
6. Longshore current – most important factor in
beach erosion and deposition
(see Figure 10.16, text)
The longshore current
Figure 10.13, text
(text, Figure 10.16)
7. Shoreline “protection”
-- Beach nourishment
-- Armoring – seawalls, groins, etc.
Shoreline Processes (continued):
(see p. 295-300 of text)
Longshore current interrupted by groins which partially prevent movement of sand and result in erosion “downstream”
Land
Shoreline Erosion
Water Groin
Sand Deposits E