Notes on T Distributions - Statistical Methods | STA 2023, Study notes of Data Analysis & Statistical Methods

Material Type: Notes; Professor: Murphy; Class: Statistical Methods; Subject: STA: Statistics; University: Valencia Community College; Term: Unknown 1989;

Typology: Study notes

Pre 2010

Uploaded on 08/03/2009

koofers-user-wzx-2
koofers-user-wzx-2 🇺🇸

10 documents

1 / 1

Toggle sidebar

This page cannot be seen from the preview

Don't miss anything!

bg1
1
NOTES: t-distributions
Hypothesis tests and confidence intervals involving mean
µ
with unknown
σ
.
Suppose that hypothesis tests and confidence intervals involving
µ
are provided with a known
standard deviation of the population
(
)
σ
. This would enable us to calculate the standard deviation of the
sample mean distribution since
( )
n
xSD
σ
=
, where
n
is the sample size. We now assume that
σ
is
not known (as is most generally the case in real life), and therefore replace
(
)
xSD
with the Standard Error
of the Mean. In other words, we use
( )
n
S
x
x
=SE
, where
x
S
is the standard deviation of the sample.
This, however, causes a problem since the
x
S
fluctuates with the sample size
n
in such a way as to create
a different (possible not normal) distributions for each sample size
n
. Each of these distributions is called
a t-distribution.
Facts about t-distributions:
bell-shaped curve
mean = 0
symmetric about 0
Each one is different from the standard normal curve. As
n
gets larger the
t-distributions get closer to the standard normal curve. When
30
n
the
t-distributions are almost normal (are very close to the standard normal curve).
degrees of freedom =
1
n
. The degrees of freedom (df) indicate which
t-distribution you will use.
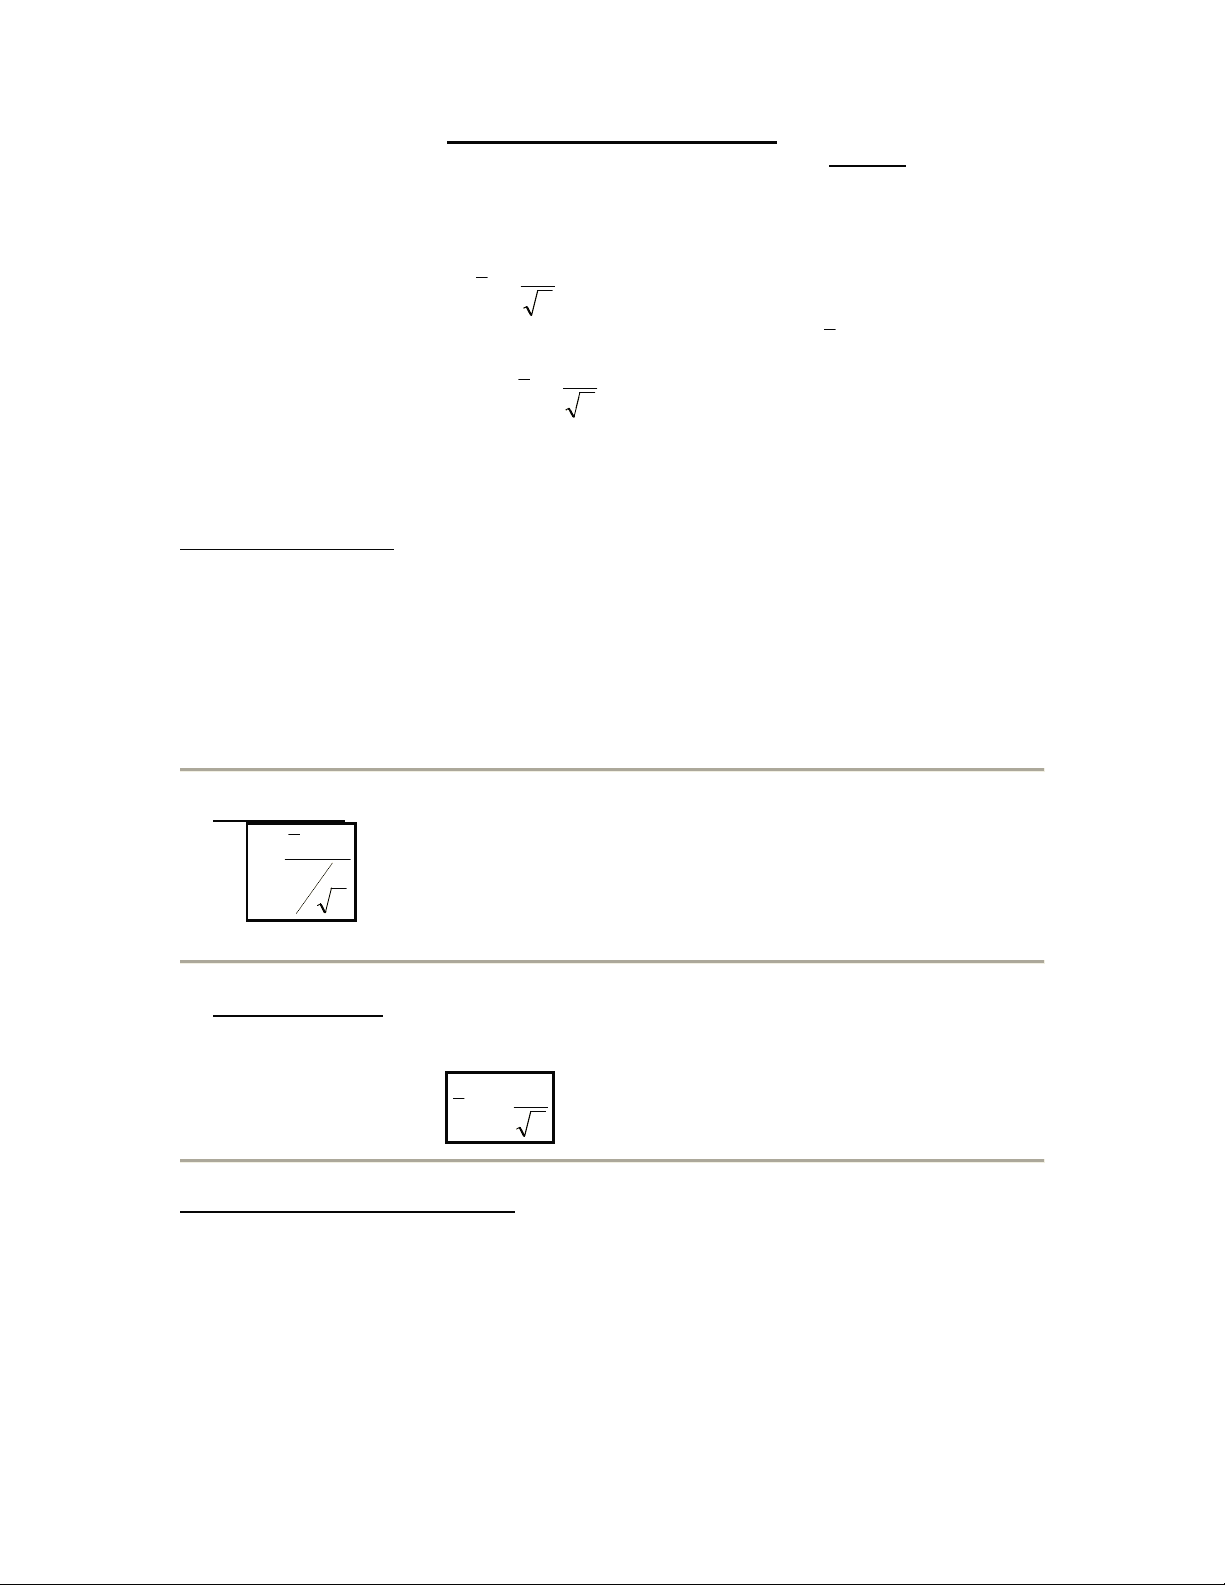
For hypothesis tests, we will use a “t-test statistic” or “t-score” instead of a z-score. The equation for the t-
score is
n
S
x
t
x
0
µ
=
, where
0
µ
is the assumed population mean from the null hypothesis
0
H
. You will
also need to use tcdf instead of normalcdf on your calculator. 2
ND
VARS tcdf. Inputs are tcdf(LB, UB, df).
For confidence intervals we will use
*t
instead of
*
z
. The
*t
value depends on the t-distribution you
are using, and so depends on the degrees of freedom (
1
n
).
*t
cannot be obtained from your graphing
calculator and so it must be looked up on a table in your textbook. The formula for a confidence interval
for means (with unknown
σ
) is
n
S
tx
x
*
±
.
Requirements for using t-distributions:
1. SRS: The sample mean must be chosen from a random sample.
2. Sufficiently large sample size:
a. CASE:
15
<
n
. The data should be very close to a Normal model. Do not use t-
methods if there is strong skewness or outliers.
b. CASE:
4015
<
n
. t-methods should work as long as the data is unimodal and
reasonably symmetric (make a histogram). t-methods should not be used in the presence
of outliers or strong skewness.
c. CASE:
n
40
. t-methods can be used even in the presence of strong skewness or a
few outliers. In this case t-methods are called “Robust.”

Partial preview of the text

Download Notes on T Distributions - Statistical Methods | STA 2023 and more Study notes Data Analysis & Statistical Methods in PDF only on Docsity!

NOTES: t-distributions

Hypothesis tests and confidence intervals involving mean μ with unknown σ.

Suppose that hypothesis tests and confidence intervals involving μ are provided with a known

standard deviation of the population ( σ ). This would enable us to calculate the standard deviation of the

sample mean distribution since ( )

n

SDx

σ

= , where n is the sample size. We now assume that σ is

not known (as is most generally the case in real life), and therefore replace SD ( x )with the Standard Error

of the Mean. In other words, we use ( )

n

S

SE x = x , where S x is the standard deviation of the sample.

This, however, causes a problem since the S x fluctuates with the sample size n in such a way as to create

a different (possible not normal) distributions for each sample size n. Each of these distributions is called

a t-distribution.

Facts about t-distributions:

  • bell-shaped curve
  • mean = 0
  • symmetric about 0

• Each one is different from the standard normal curve. As n gets larger the

t-distributions get closer to the standard normal curve. When n ≥ 30 the

t-distributions are almost normal (are very close to the standard normal curve).

• degrees of freedom = n − 1. The degrees of freedom ( df ) indicate which

t-distribution you will use.

For hypothesis tests , we will use a “t-test statistic” or “t-score” instead of a z-score. The equation for the t-

score is

n

S

x

t

x

= −^ μ^0

, where μ 0 is the assumed population mean from the null hypothesis H 0. You will

also need to use tcdf instead of normalcdf on your calculator. 2 ND^ VARS tcdf. Inputs are tcdf (LB, UB, df).

For confidence intervals we will use t *instead of z *. The t *value depends on the t-distribution you

are using, and so depends on the degrees of freedom ( n − 1 ). t *cannot be obtained from your graphing

calculator and so it must be looked up on a table in your textbook. The formula for a confidence interval

for means (with unknown σ ) is

n

S

x ± t * x.

Requirements for using t-distributions:

  1. SRS: The sample mean must be chosen from a random sample.
  2. Sufficiently large sample size:

a. CASE: n < 15. The data should be very close to a Normal model. Do not use t-

methods if there is strong skewness or outliers.

b. CASE: 15 ≤ n < 40. t-methods should work as long as the data is unimodal and

reasonably symmetric (make a histogram). t-methods should not be used in the presence of outliers or strong skewness.

c. CASE: 40 ≤ n. t-methods can be used even in the presence of strong skewness or a

few outliers. In this case t-methods are called “Robust.”