


1
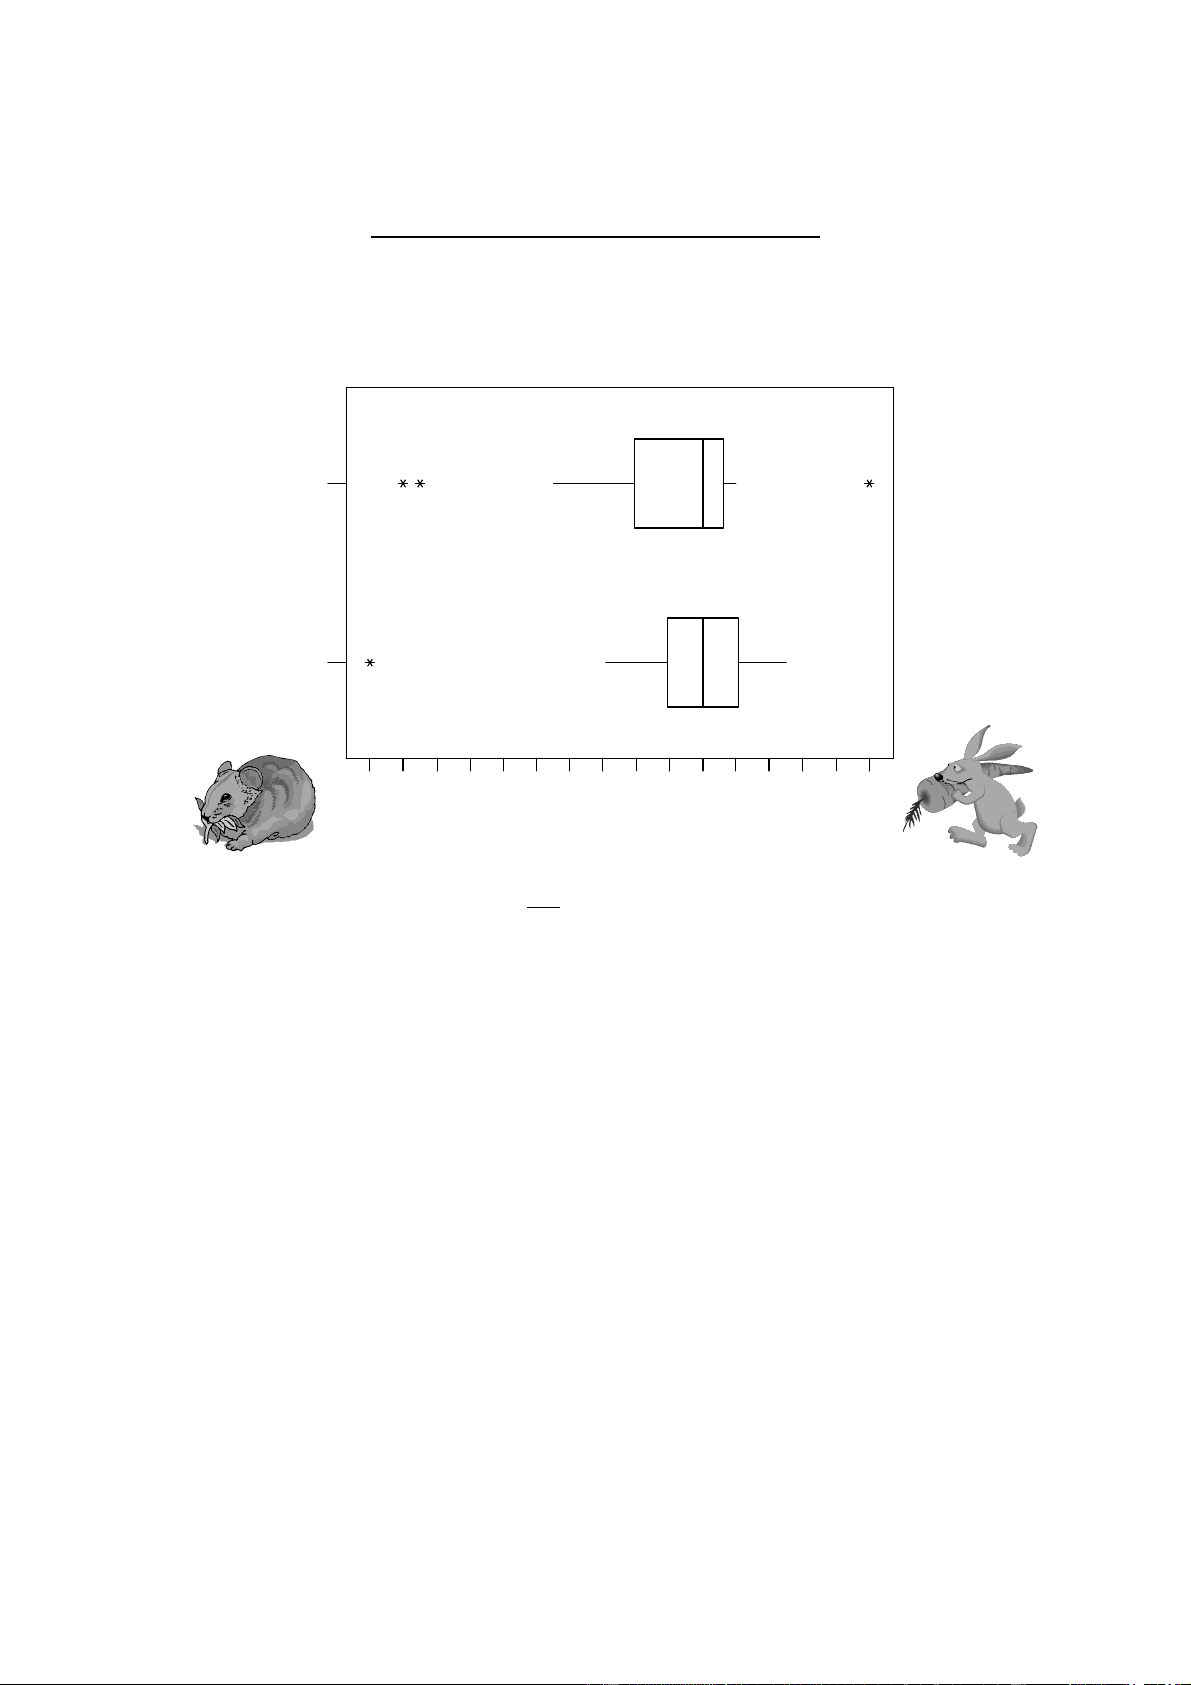
Hamsters
Rabbits
22212019181716151413121110987
Grams of food eaten
Side-by-side boxplots: hamsters and rabbits.
The manager of a pet store records the amount of food eaten for each hamster and
rabbit in the store. The information he obtains is represented in the side-by-side boxplot
below. (Note that the pets in the store are the individuals, the type of pet (hamster, rabbit,
etc.) is a categorical variable and the “grams of food eaten” is a quantitative variable).
NOTE: each bullet below represents one distinct comparison/contrast.
• Hamsters have three outliers: two at the low end (8 grams and 8.5 grams) and one
at the high end (22 grams). Rabbits have one outlier at the low end (7 grams).
• The Interquartile Ranges (IQRs) of both groups are about the same: hamsters
IQR is
5.2155.17
=
−
grams, rabbits IQR is
21618
=
−
grams.
• If we exclude the hamster that ate 22 grams, then we can say that 25% of the
rabbits ate more than any hamster (
3
Q for rabbits is the same as maxX for
hamsters, again excluding the high outlier for hamsters).
• The spread for hamsters is from 8 grams to 22 grams and the spread for rabbits is
from 7 grams to 19.5 grams. The range for hamsters is
14822
=
−
grams which is
just a little more than for rabbits
5.1275.19
=
−
grams. If we don’t include the
outliers we see that the range is the same for rabbits (
5.5145.19
=
−
grams) as it
is for hamsters (
5.55.1218
=
−
grams).
• The median grams of food eaten by rabbits is the same for hamsters (17 grams),
however both
1
Q and
3
Q for rabbits are higher than
1
Q and
3
Q for hamsters,
respectively. Also, the rabbits’ minX and maxX are higher than the minX and
maxX for hamsters, respectively (ignoring outliers, otherwise the reverse is true!).
• The distribution for hamsters is definitely skewed left, whereas the distribution for
rabbits is fairly symmetrical.