1
1110987654
4
3
2
1
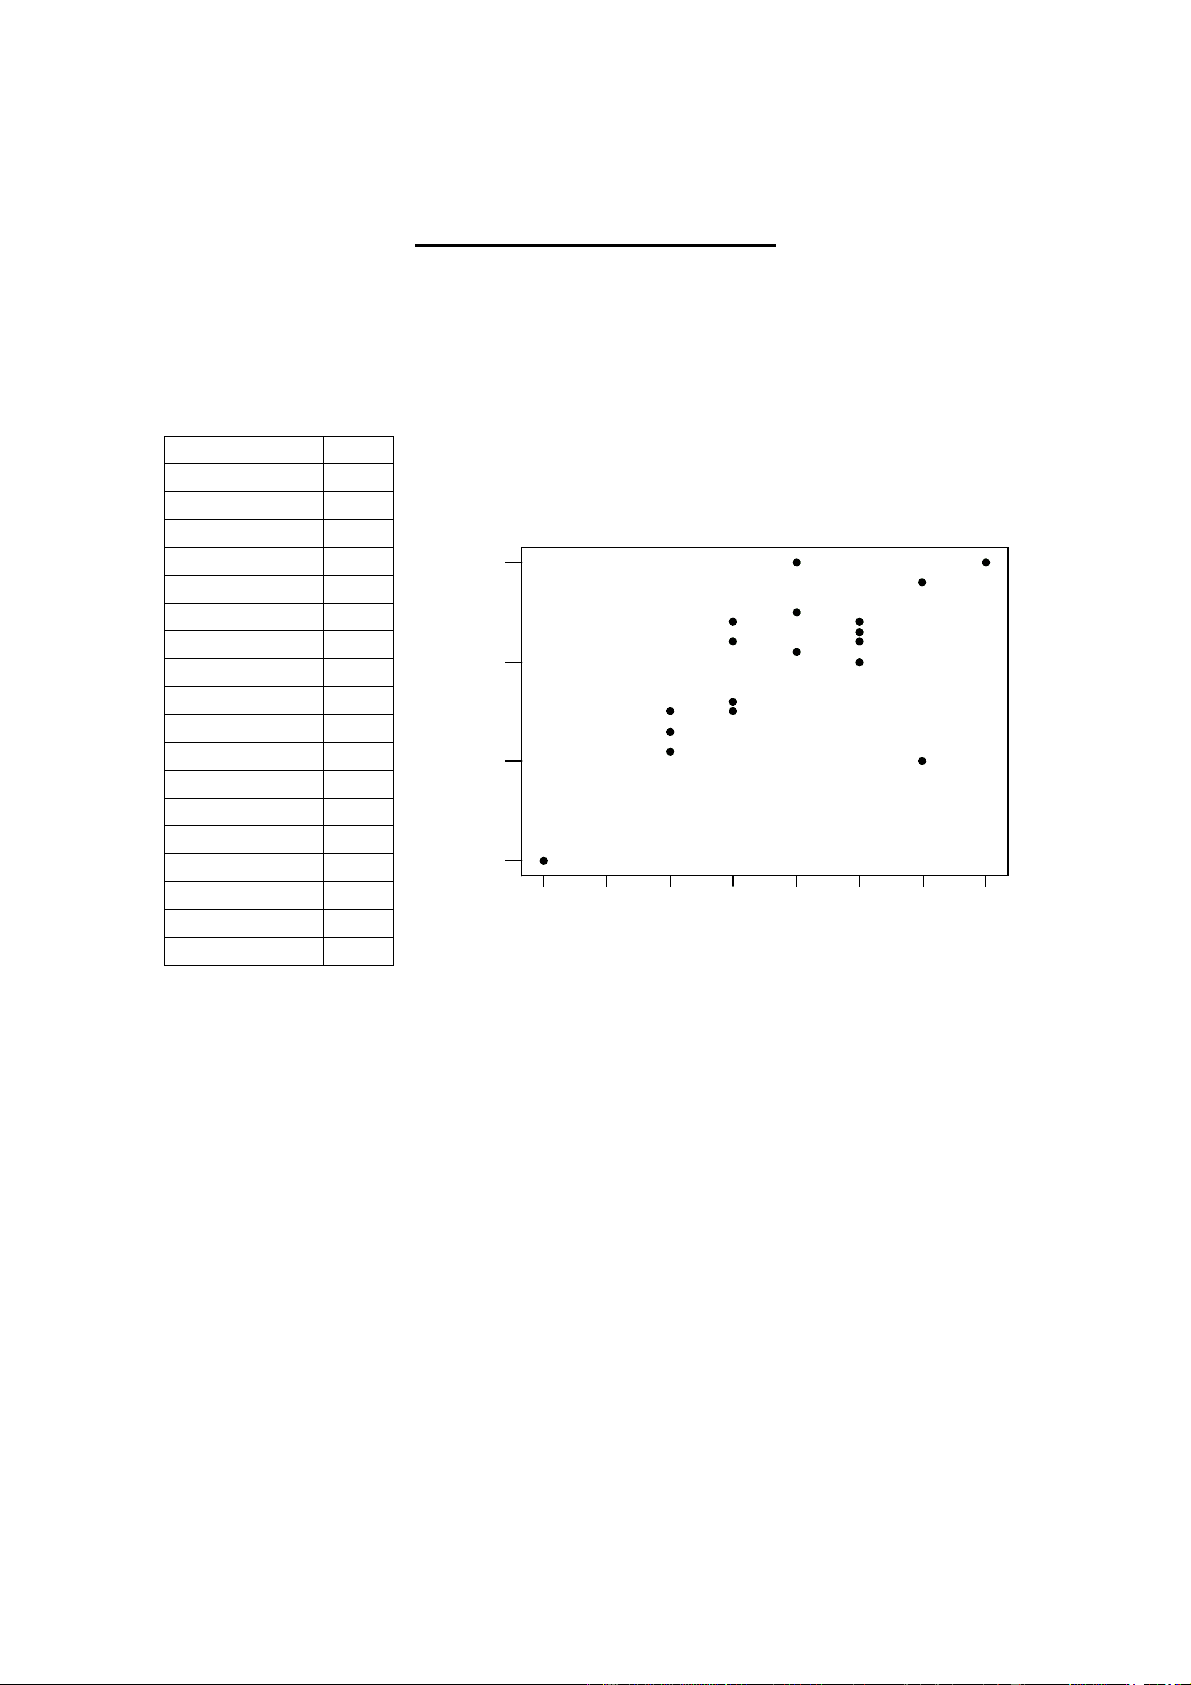
Hours of Sleep
GPA
GPA versus Hours of Sleep
Suppose that you wanted to “explain” how the amount of sleep you get each night affects
your GPA. If you were to gather data of others GPA and hours of sleep, you might be
able to “predict” your GPA given the amount of sleep you get each night. Another way
of thinking about this is that GPA is a “response” to the hours of sleep you get. Below is
an example of data gathered on 18 students.
X is the Explanatory (or Predictor) variable
Y is the Response variable
When we say we are graphing “GPA versus Hours of Sleep” then
we are graphing “Y versus X”.
1. Describe the form and strength of the scatterplot.
2. State and interpret the association of these two variables.
Hour of Sleep
GPA
8 3.1
7 3.4
10 2.0
8 3.5
6 2.3
9 3.4
7 3.2
7 2.5
6 2.1
11 4.0
8 4.0
4 1.0
6 2.5
9 3.0
10 3.8
7 2.6
9 3.2
9 3.3